Lisa T. MillerGet Started

DATA AND BENCHMARKS

AI and the Business of Healthcare, Statistics and Benchmarks

Verified figures on administrative costs, denial rates, prior authorization, AI adoption, documentation savings, and ROI. Every number is sourced. Updated regularly.
~25%
Of hospital spending is administration, not care
Health Affairs, 2014
$19.7B
Spent yearly pursuing denial appeals
Premier Inc., 2022 data
13 hrs
Per physician per week on prior auth
AMA, 2024
3.2:1
Average ROI on healthcare AI
Industry compilations, 2025
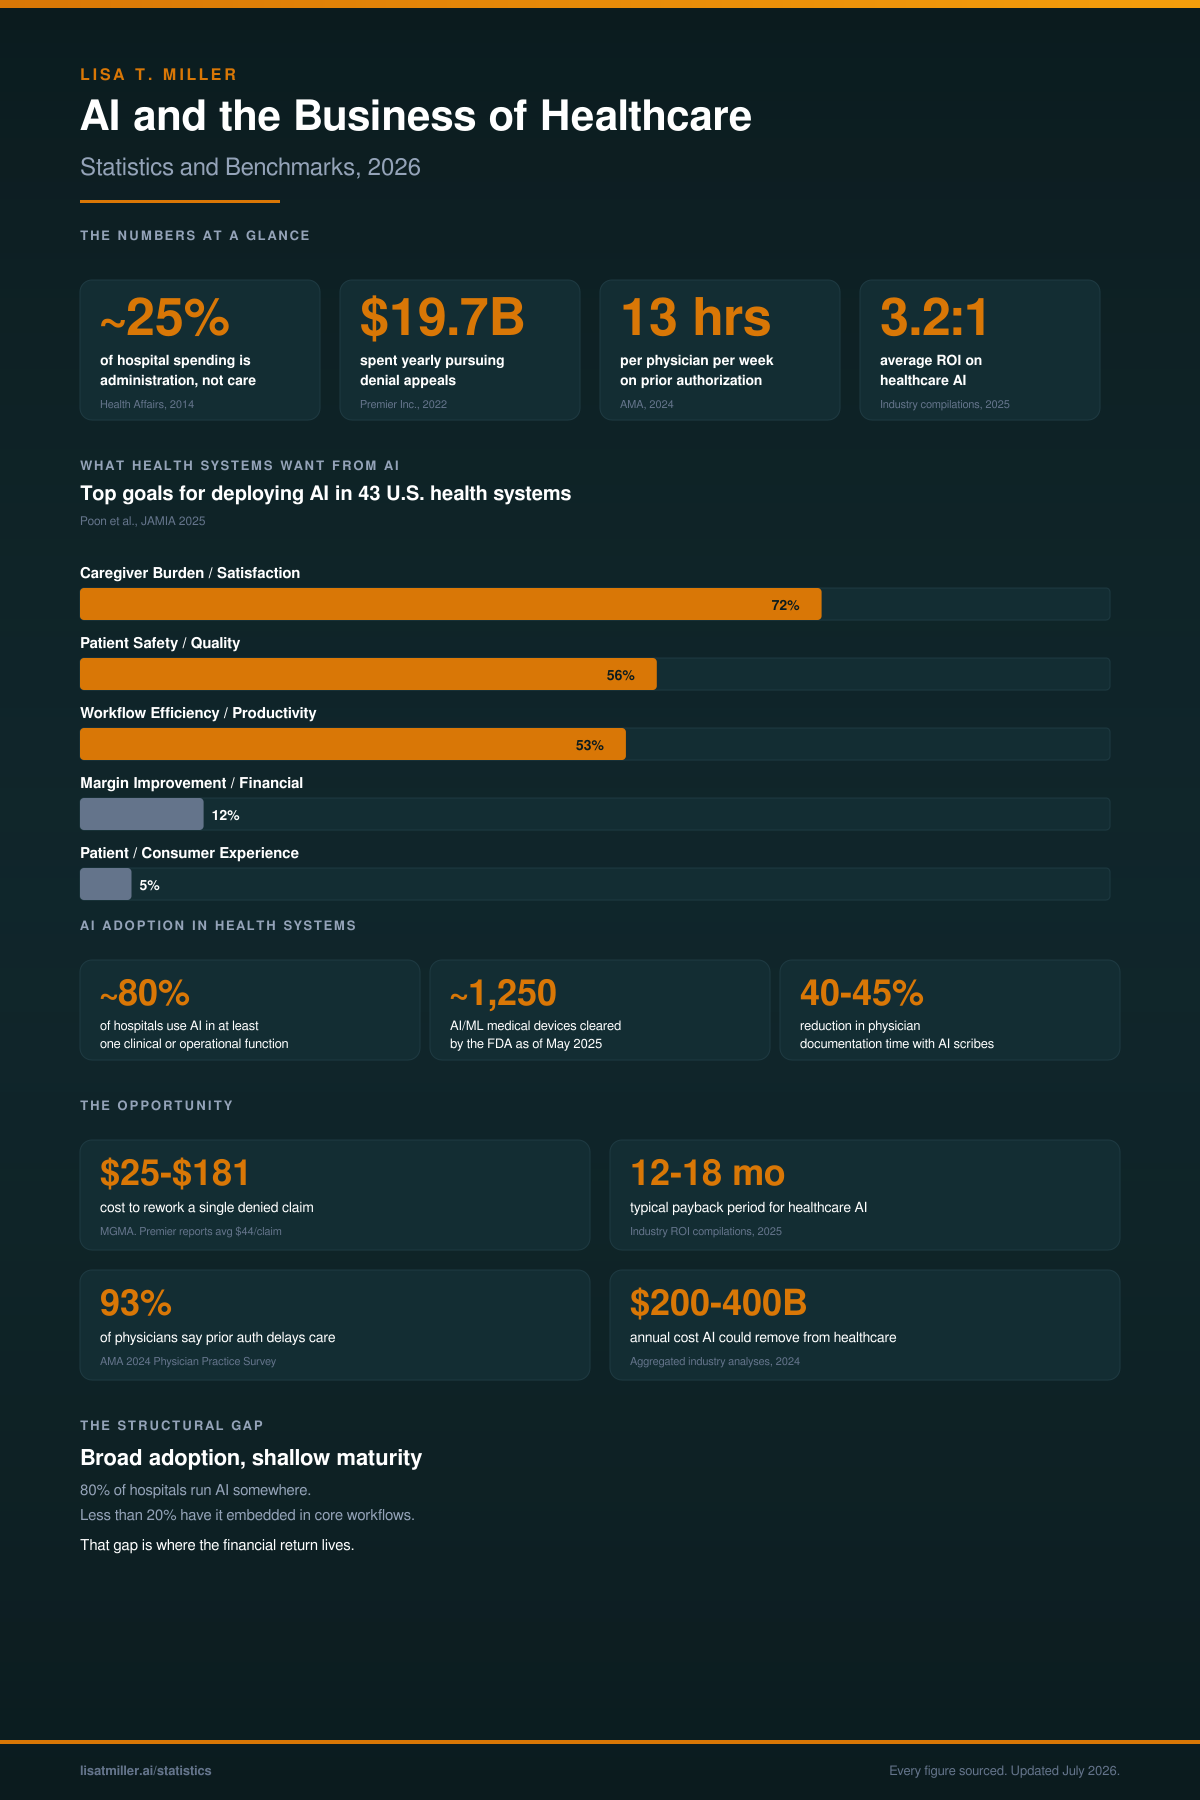
AI and the Business of Healthcare statistics infographic showing 25 percent admin spending, 19.7 billion denial appeals, 13 hours prior auth, 3.2 to 1 ROI, and JAMIA 2025 health system AI goals chart

Administrative Cost Burden

The cost of running hospitals in the United States is heavily administrative. These figures quantify work that does not involve patient care, and they define the opportunity AI can absorb.

~25%
Of U.S. hospital spending is administration, not care
Himmelstein et al., Health Affairs, 2014. Confirmed in 2025 PMC review (PMC11702416).
$19.7B
Spent yearly by U.S. health systems pursuing denial appeals
Premier Inc., analysis of 2022 denial data. Cited by AHA and Modern Healthcare.
~31%
Of total U.S. healthcare spending is administration
Woolhandler et al., Annals of Internal Medicine, 2023. Broader measure across all payers and providers.

The 25 percent figure is hospital specific. The 31 percent figure captures administration across the entire U.S. healthcare system, including insurance overhead. Either way, the cost is structural. It does not appear on a single budget line. It is distributed across every department and absorbed by existing staff.

AI Adoption in Health Systems

Adoption is now broad but uneven. Most hospitals run AI somewhere, but far fewer have embedded it deeply into core workflows.

~80%
Of hospitals use AI in at least one clinical or operational function
American Hospital Association and cross-survey analyses, 2024 to 2025.
~89%
Of healthcare executives report using AI in at least one function
Industry executive survey synthesis, 2025.
~2 in 3
Of U.S. physicians used some form of health AI in 2024, up from ~2 in 5 the prior year
AMA Augmented Intelligence Survey, 2024 to 2025. A 78 percent year-over-year increase.
~46%
Of healthcare organizations remained in early-stage generative AI implementation in 2024
Docus.ai industry compilation, 2024. Broad adoption, shallow maturity.
<20%
Of institutions report sustained high-success use of AI in core clinical diagnosis
PMC review of real-world deployments (PMC12202002), 2025.
40-60%
Of large health systems run more than five AI vendors in production simultaneously
Cross-CIO survey synthesis, 2025. A shift from single-vendor pilots to portfolio governance.

The gap between broad adoption (80 percent) and deep clinical integration (under 20 percent) is the central structural fact. Organizations are running AI somewhere. Far fewer have it embedded in the workflows where the financial return lives.

What Health Systems Want From AI

A 2025 study published in JAMIA surveyed 43 U.S. health systems on their top goals for deploying AI. The results cut against the assumption that margin improvement is the primary driver.

Caregiver Burden / Satisfaction
72%
Patient Safety / Quality
56%
Workflow Efficiency / Productivity
53%
Margin Improvement / Financial
12%
Patient / Consumer Experience
5%

Source. Poon et al., JAMIA 2025. Survey of 43 U.S. health systems. Caregiver burden and workflow efficiency dominate. Margin improvement ranks fourth at 12 percent. The financial case for AI is real, but health systems are prioritizing the human cost of broken workflows first.

Revenue Cycle and Denials

The revenue cycle is where AI delivers the most measurable financial return. Denial prevention, not denial recovery, is where the savings concentrate.

$19.7B
Spent yearly by U.S. health systems pursuing denial appeals
Premier Inc., analysis of 2022 denial data.
$25-$181
Cost to rework a single denied claim
MGMA data. Premier reports an average of $44 per claim across surveyed health systems.
~85-90%
Accuracy of AI-based revenue cycle and billing anomaly detection tools
SQ Magazine industry compilation, 2025.

Every denied claim that is prevented upstream saves the rework cost, the staff hours, and the revenue cycle lag. AI claim scrubbing and eligibility verification move the intervention from after denial to before submission.

Prior Authorization

Prior authorization is one of the most widely cited administrative burdens in U.S. healthcare. The hours are measurable, and AI can absorb a significant share.

13 hrs
Average weekly time per physician spent on prior authorization
AMA 2024 Physician Practice Survey. 1,000 practicing primary care physicians surveyed.
39
Average prior authorization requests completed per physician per week
AMA 2024 Physician Practice Survey.
93%
Of physicians report prior authorization delays patient care
AMA 2024 Physician Practice Survey.

AI absorbs prior authorization work by extracting clinical documentation and submitting requests to payer portals automatically. The 13 hours per physician per week is the baseline. The opportunity is measurable in both hours returned and care delays prevented.

Documentation and Workflow

AI scribes, ambient documentation, and EHR summarization have produced the clearest, most repeatable productivity gains in clinical operations.

40-45%
Reduction in physician documentation time with AI scribes
SQ Magazine and Azumo compilations, 2025.
~90%
Of U.S. health systems using AI to automate some aspect of EHR documentation by 2025
SQ Magazine industry compilation, 2025.
25-30%
Reduction in clinical note error rates in AI scribe deployments
SQ Magazine compilations, 2025.
50%+
Reduction in time spent retrieving patient histories with AI EHR search
SQ Magazine compilation, 2025.
+10-29%
Increase in patient discharges in a large hospital network using predictive AI monitoring
Strategic Market Research case study, 2025.
~0.7 days
Drop in average length of stay in the same predictive AI deployment
Strategic Market Research case study, 2025.

Financial Impact and ROI

Short-payback ROI is now consistently reported across vendors and health systems. The financial case has moved from theoretical to measurable.

3.2:1
Average ROI on healthcare AI investments
Vention Teams and Azumo industry compilations, 2025.
12-18 mo
Typical payback period for healthcare AI investments
Industry ROI compilations, 2025.
~$20B
Projected medium-term annual reduction in U.S. healthcare administrative cost from AI
Azumo industry analysis, 2025.
$200-400B
Estimated annual cost AI could ultimately remove from global and U.S. healthcare systems through automation, triage, fewer complications, and reduced readmissions
Aggregated industry analyses and PMC review (PMC11702416), 2024.
2x+
Minimum ROI bar for AI deployments in health system operations
Industry standard for measured deployments. Most rigorously measured deployments clear this bar.

The 3.2 to 1 ROI and 12 to 18 month payback figures are industry averages. Individual deployments vary based on workflow mapping, baseline rigor, and change management. The 2x minimum is the practical bar for scaling a deployment after its 90-day proof window.

FDA and Regulatory

The FDA AI/ML device list is the single best leading indicator of clinical-grade AI maturity. It is public, dated, and taxonomized.

~1,250
AI or ML enabled medical devices cleared or approved by the U.S. FDA as of May 2025
U.S. FDA AI/ML Enabled Medical Devices list, May 2025.
~76%
Of FDA-cleared AI/ML medical devices are in radiology
U.S. FDA AI/ML database breakdown, 2025.
~5x
Growth in cumulative FDA-cleared AI/ML devices between 2020 and 2025
FDA AI/ML cumulative dataset, 2020 to 2025.

Radiology dominates the regulatory landscape. The vast majority of FDA-cleared devices are narrow, task-specific models trained on labeled medical imaging data. Generative and foundation-model AI represents a limited but growing share.

Clinical Diagnostic Accuracy

Narrow AI models matched against bounded tasks now reach or exceed specialist performance. The gap appears when models are asked to handle open-ended diagnosis on unfiltered presentations.

~96%
Accuracy of AI algorithms in diabetic retinopathy detection, outperforming specialists by 10+ percentage points
2025 clinical trial syntheses. Azumo and SQ Magazine compilations, 2025.
90-92%
Sensitivity for early-stage breast cancer in AI-assisted mammography
Strategic Market Research, 2025. Azumo synthesis.
~33%
Reduction in emergency department misdiagnosis rates in large trials of AI diagnostic decision support
Industry trial syntheses, 2025.
25-30%
Increase in radiologist throughput with AI assistance, maintaining or improving diagnostic performance
Strategic Market Research, 2025.
~50%+
Average diagnostic accuracy of generative AI models in meta-analyses, comparable to non-expert clinicians, below specialists
PMC peer-reviewed meta-analysis (PMC11702416), 2024.
20+ min
Reduction in average ED wait time in studies deploying ML triage tools
SQ Magazine ED triage compilation, 2025.

Market Size and Growth

Healthcare is one of the largest verticals for AI spending. Every credible synthesis projects a tripling to quintupling of market size between 2025 and the early 2030s.

~$120B
Forecasted global AI in healthcare revenue by 2028, at a CAGR of approximately 35 to 40 percent
Strategic Market Research synthesis, 2025.
~5x
Growth in the share of healthcare organizations with domain-specific AI in production between 2024 and 2025
Menlo Ventures, 2025 State of AI in Healthcare.
~1 in 5
Healthcare organizations had a domain-specific AI tool in production by 2025, a multi-fold jump from 2024
Menlo Ventures, 2025.

Patient Engagement

Consumer-side adoption of AI in healthcare has run faster than the institutional side. Patients are already using general-purpose AI tools to interpret their own care.

~1 in 3
U.S. adults now use AI chatbots for health information, roughly double the share from a year earlier
Azumo consumer survey synthesis, 2025.
~53%
Of consumers believe AI will improve access to care
Deloitte Health Care Consumer Survey, 2024 to 2025.
~25%
Increase in patient follow-up adherence in remote-care settings using AI health assistants
SQ Magazine compilation, 2025.

How to Use These Benchmarks

These figures serve three purposes for health system leaders evaluating AI.

1. Price the status quo
Use the administrative cost, denial, and prior auth figures to quantify what your organization is spending on work that should not exist. Pull your own actuals and compare.
2. Set the ROI bar
Use the 3.2 to 1 average ROI and 2x minimum bar to evaluate whether a deployment is worth scaling. If it does not clear 2x after 90 days, stop.
3. Benchmark adoption
Use the adoption figures to understand where your organization sits relative to peers. If 80 percent of hospitals are running AI somewhere and you are not, the gap is structural.

Want help applying these benchmarks to your operations?

Schedule a Strategy Call. Twenty minutes, no cost. We'll map where your numbers sit relative to these benchmarks and what AI can absorb today.

Schedule a Strategy Call
Last updated July 19, 2026. All figures verified against primary sources. This page is updated as new data becomes available.